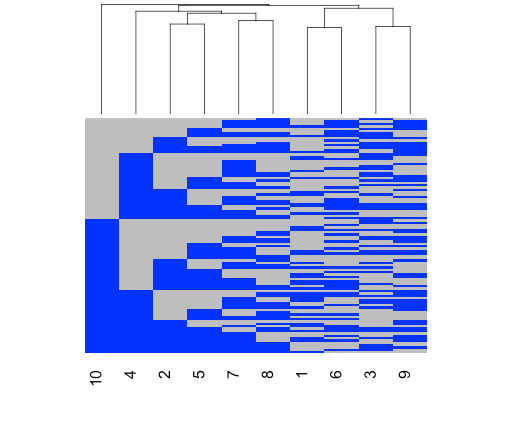
Here is a bit of code for making a heatmap, which orders the rows of a matrix such that the first column (as ordered by in the dendrogram) has all 0s then all 1s, then the 2nd column is similarly ordered in two groups conditioning on the 1st column and so on. Hard to explain but easy to see in the picture below. I came up with raising to the power of 2 quickly, but then it took me a few minutes to realize I have to multiply the columns by the order of the order.
x <- replicate(10,sample(0:1,100,TRUE))
library(gplots)
hc <- hclust(dist(t(x)))
y <- sweep(x,2,2^(ncol(x)-order(hc$order)),"*")
z <- x[order(rowSums(y)),]
heatmap.2(z, trace="none", key=FALSE,
          Rowv=FALSE,labRow=FALSE,
          Colv=as.dendrogram(hc),
          dendrogram="column",
          scale="none",col=c("grey","blue"),
          lwid=c(2,10))